.jpg.bee6da21545b36ee147b8b8fe68bc87e.jpg)

September 2017
To create a realistic pathway to a low-carbon regional transportation system, science—not activism—needs to lead the way forward.
IT HAD LONG BEEN MY UNDERSTANDING that cycling—all on its own—would become a significant part of the solution for reducing local transportation emissions. However, when I used the Capital Regional District’s most recent comprehensive travel survey to estimate the relative amount of work done by each form of transportation at the regional level, I was flabbergasted to find that cycling accounts for such a tiny share: 1.5 percent in 2011.
The amount of work done by each transportation mode can only be compared when you consider the total distance travelled each day by CRD residents using each type of transport. Replacing the work done by fossil-fuelled automobiles is essential if we’re going to reduce emissions. But how much of that work can be replaced by humans exerting themselves by cycling or walking instead of driving?
More than is currently the case in our region, no doubt. But when we consider how to shift enough of the work done by automobiles to more energy efficient modes of transportation, like walking, cycling, and transit, the magnitude of the challenge facing us becomes clear. There has to be a huge shift in how people move around, quickly. Why time is such a critical part of the equation should be obvious, and the Trudeau government’s announcement late last year of a mid-century emissions goal establishes the rate of descent for making reductions. The perplexing question is: What do we shift to?
Cycling and walking are part of the solution, but there needs to be a massive shift of the work done by cars to public transit. If other places that have already made this change are any indication of what Victoria will choose to do, the role of cycling and walking will largely be for making the first short leg of a trip made by public transit. While we’re seeing local governments create isolated pockets of inordinately expensive improvements for cycling, there’s little evidence that the region is on the verge of making sensible (let alone massive) investments in public transit.
I pointed this out in the last edition in “Mayor Helps’ 1.5 percent solution,” which was subtitled, “Local government’s response to reducing transportation emissions may be wishful thinking. Or foolish.”

New two-way protected cycling corridor in Downtown Victoria
Responding at a local level to the existential threat posed by climate change, rising sea level and ocean acidification—all caused by carbon emissions—will be a transformative, Herculean task that requires constant, difficult conversation about the path we should be on. If we Earthlings don’t do this work—including the conversations—we’re cooked.
What is the task facing us? According to the CRD, 55 percent of emissions generated in the region come from fossil-fuelled vehicles. Unless there is a significant and quick decline in their use, the planet will be at increasing risk of runaway warming. We simply can’t take a long-term approach to this shift. How rapidly do we need to act?
The Trudeau government’s overall emissions goal is to lower them by 80 percent (compared with 2005 levels) by 2050. As yet, no targets have been set for individual economic sectors, but it’s reasonable to assume that the transportation sector’s contribution would have to be on the order of 80 percent, give or take a few percentage points. To be on the most gradual descent that would get Canada to that goal, transportation emissions, and those from other sectors, would need to be reduced by about 34 percent over the next 12 years.

Canada’s mid-century emissions target, announced in late 2016, means an overall emissions reduction of 34 percent by 2030—12 years from now.
To put that time frame into perspective, consider that the City of Victoria started the process to replace the Johnson Street Bridge in 2008. It will, hopefully, open for traffic in 2018, ten years later. The amount of time left before 2030 is only a little longer than the City of Victoria needed to build a 156-metre-long bridge.
What would this rapid transformation mean for drivers of fossil-fuelled cars in Victoria? Collectively, over the next 12 years, we will have to either drive 34 percent less distance each day, get new vehicles that use, on average, 34 percent less fuel, shift 34 percent of our travel to non-fossil-fuel modes of transportation, or employ a strategy that combines some or all of these.
What is the CRD’s plan for responding to the goals announced by the Trudeau government in late 2016? In its already-outdated 2014 Regional Transportation Plan (RTP), the CRD noted: “Long-term transportation planning efforts and investments are therefore needed to help reduce GHG emissions and adapt to a changing climate—both requirements are fundamental principles to all of the themes elaborated in this RTP. This means focusing on integrating land use and transportation planning to support sustainable transportation choices and reduce trip distances.”
The CRD’s short-term plan is to double ridership on public transit by 2030 and build more cycling and pedestrian infrastructure.
Will this suffice to meet our national emission reduction target? The short answer is a definite “No.” I’ll show you the arithmetic for that conclusion later on.
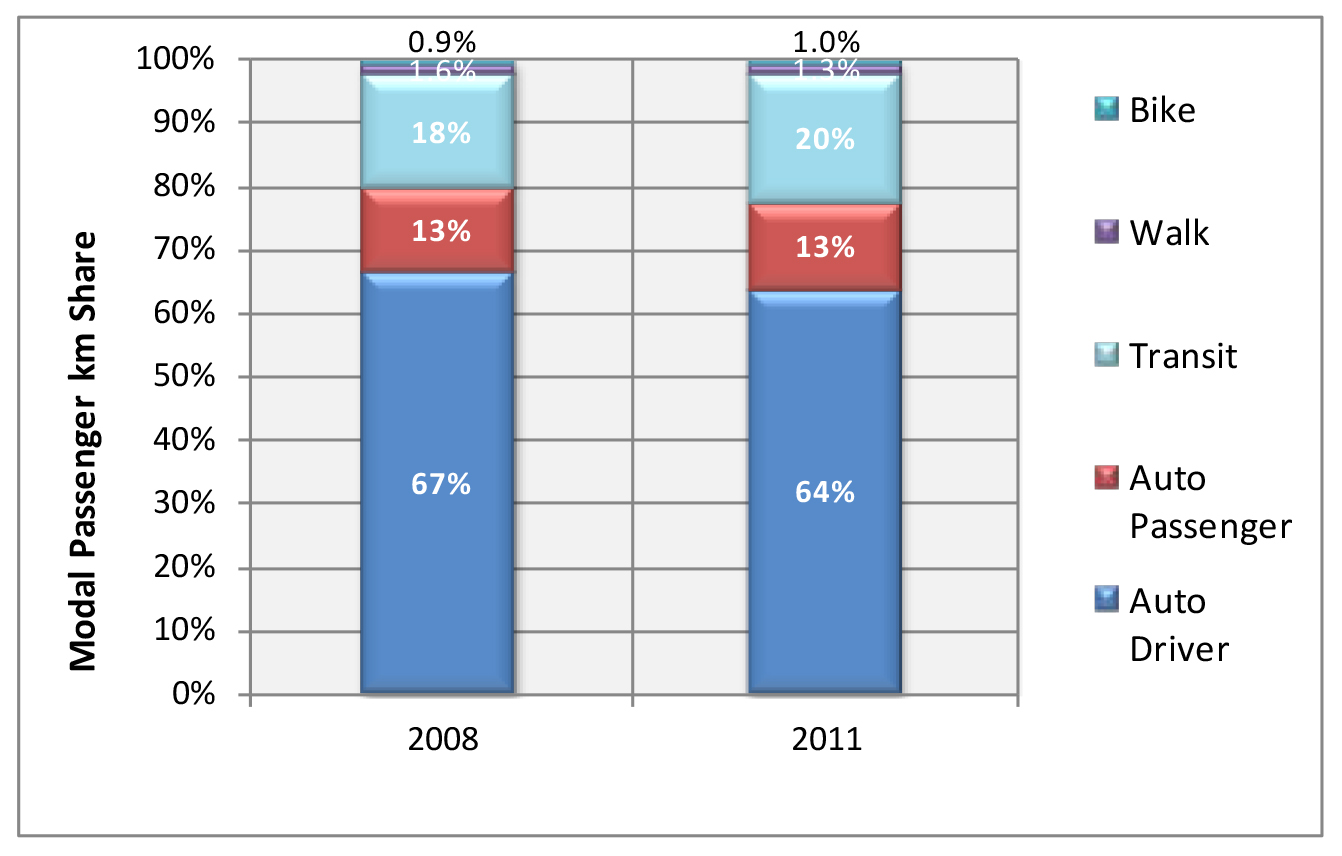
In “Mayor Helps’ 1.5 percent solution” I used the CRD’s most recent and most comprehensive survey of the region’s transportation system, done in 2011. It showed that autos accounted for 88 percent of the distance travelled in the CRD each day. By comparison, public transit accounted for 7.1 percent, walking 1.7 percent, and bicycles 1.5 percent. I questioned whether the CRD’s plan would be able to significantly shift the share of the work being done by the various modes of transportation enough to significantly reduce emissions.
These numbers baffled cycling advocates, who were more familiar with “mode share” to describe cycling’s contribution to our transportation needs. Mode share is a way of comparing the number of individual trips made by each form of transportation in a day. Using mode share, both a 3-kilometre trip on a bicycle and a 10-kilometre drive in a car are given equal weight. Although the CRD’s 2011 information shows bicycling had a mode share of 2.8 percent in the region, in certain places and for certain trip purposes, such as commuting to work in the City of Victoria, cycling’s mode share can be considerably higher. The Victoria area isn’t much different from Vancouver, where cycling accounts for about 1 percent of total distance travelled. Notably, Metro Vancouver’s equivalent of the travel study done by the CRD includes such information, whereas the CRD does not.
Share of total distance travelled by each mode of travel (Source: 2011 Metro Vancouver Regional Trip Diary Survey Analysis Report)
Presenting basic information about the work done by components of transportation systems in this way might be discouraging to cyclists. However, when the primary consideration is reduction of emissions, “mode share” provides no useful information. As laid out in the CRD’s emissions reduction plan, the task will be to shift some fossil-fuelled auto use to a combination of transit, cycling and walking. Only by including the distance travelled, which reflects all the current realities about where people live, study, work and play and how far they have to travel each day to accomplish what they need to do, can we gauge how much energy needs to be shifted from autos to other modes. To put it as plainly as possible, a 34 percent reduction in emissions would require, after factoring in small increases in fuel efficiency and a small shift to electric vehicles, a shift of about 25 percent of the distance travelled in fossil-fuelled autos to non-fossil-fuelled modes over the next 12 years. I’ll elaborate on this later.
AS MENTIONED ABOVE, my use of “total distance travelled” to compare the current energy contribution of different modes baffled cycling advocates. Former City of Victoria councillor John Luton, who has played a lead role in promoting cycling infrastructure projects in the region, wrote on Facebook, “Stories emerging from unreliable sources claim that CRD numbers show that only 1.5 percent of trips in the region are bicycle trips.” Luton went on to state, “Promoters of this theory are dishonest or unable to understand statistical information…The premise used to sell this fairy tale is that total mileage equals number of trips. That is false.…lying about the numbers is not a useful contribution to these discussions.”
Edward Pullman, president of the board of directors of the Greater Victoria Cycling Coalition, responded to Luton: “Spot on John. By focussing exclusively on total distance travelled, folks that commute long distances become more important than those that live closer to their destinations. It’s a bizarre perversion of commuter choices.”
Contacted by email, neither Luton nor Pullman could explain what their comments had meant. The story did not propose that “total mileage equals number of trips,” as Luton claimed.
Former MLA and cycling advocate David Cubberley asserted: “There are no useful analytics involved in focussing on total distance travelled.”
In a letter to Focus, Paul Rasmussen wrote, “Using the percentage of total miles travelled by mode… seems designed to minimize the positive impact of cycling.”
The idea that our story was intentionally “designed to minimize the positive impact of cycling” occurred to other readers, as well.
Transportation planning consultant Todd Litman wrote a lengthy response to our story in an online blog in which he claimed I had written that bicycle lanes were “wasteful” and “unfair to motorists.” On the basis of those claims—neither of which were made in our article, or intended—Litman continued on to assert what possessing such beliefs must indicate about the writer, including this zinger: “Critics like Broadland imply that cycling facilities only benefit a small number of serious cyclists—those who ride expensive racing bikes wearing lycra.”
Nothing like that, though, was either stated or intended in our story.
Luton, Pullman, Cubberley, Rasmussen and Litman are all in a position to influence the CRD’s plan for reducing emissions and the expenditure of many millions of dollars in public resources, yet none of them seemed able to understand what the CRD’s own numbers say about the magnitude of the energy shift that will be required to meet the federal target. Instead, they mounted a defense of cycling on the basis of other details we reported—or didn’t report—about the new Pandora Avenue protected bike lanes.
Litman complained: “By extrapolating the Pandora bike lane cost to other Downtown arterials, Broadland estimates that Victoria’s cycling program will cost $16 million, which is almost certainly an exaggeration since the first project is always more costly than those that follow.”
But the City’s record of underestimating and hiding project costs is a matter of public record. For example, when City councillors voted to replace the Johnson Street Bridge in 2009 they understood the project would cost $40 million. It’s now close to triple that. A more prudent reporter would have pushed the City’s bike lane estimate much higher. I simply extended the City’s actual cost per kilometre for the Pandora lanes—which was higher than the City’s budget estimate—to the full length of the protected corridor it plans to build.
Merely reporting the likely cost of the planned Downtown protected network was, it seemed, enough to set the cycling advocates’ sense of fairness on fire. Rasmussen wrote, “Broadland criticizes the cost of the project—which he claims will be $16 million—over twice as much as the City says it will cost. In the eight years I’ve lived in Victoria, this is the first time that any entity has spent any significant amount of money on bike infrastructure. Meanwhile, just off the top of my head, I can count three significant projects for automobile traffic within the CRD in the last few years—the McTavish Interchange at $24 million, the Johnson Street Bridge project at $100 million and counting, and the McKenzie Interchange project at least $85 million. So that’s at least $210 million for car infrastructure just in major projects. Maybe even $16 million for something that promotes a clear social good isn’t so much?”
Rasmussen could have included the $30-million Leigh Road Interchange (aka The Bridge to Nowhere) in Langford on that list, but let’s examine his claim a little more closely. The cost of the new McKenzie interchange, for example, includes the cost of space for cyclists, pedestrians and public transit. The new Johnson Street Bridge also includes space for those three non-car modes. In fact, 53.5 percent of the bridge’s available deck space is dedicated to pedestrians and cyclists. If the final cost of the bridge is $115 million—which it will be once hidden and as-yet undetermined costs for landscaping and additional protective fendering are included—should 53.5 percent of that cost be assigned to cycling and walking? That would be $62 million. Moreover, the public record of how this project unfolded shows that cycling advocates greatly overstated the extent to which the old bridges were being used by cyclists and their exaggerations helped to inflate the project into the public works nightmare it has become (See “Juking the stats,” Focus November 2011).

Comparison of the space for autos (red) and cyclists and pedestrians (green) on the new Johnson Street Bridge (Source: PCL drawing)
In Litman’s response to our story he wrote, “Cyclists just want a fair share of public resources (transportation funding and road space). What would be fair? You could argue that it should be about equal to cycling’s mode share: if 5 percent of trips are by cycling then it would be fair to invest 5 percent of public resources in cycling facilities. But this is backward looking since it reflects the travel patterns that occur under current conditions, ignoring ‘latent demand,’ the additional cycling trips that some travellers want to make but cannot due to inadequate facilities. To respond to these demands it would be fair to invest the portion of money and road space that reflects the mode share after those programs are completed; if comprehensive planning is likely to result in 10 percent cycling mode share, it would be fair to invest 10 percent of transportation funds and road space in cycling facilities.”
Litman’s point isn’t particularly relevant to a discussion focussing on whether proposed bicycle and LRT infrastructure will effectively address emissions reduction, but it’s worth exploring. The record at the City of Victoria shows that transportation infrastructure decisions have been wonky, but not in the direction Litman claims. Again, consider the new Johnson Street Bridge. In the only reliable survey comparing trips across the bridge—published in a 2010 economic assessment used by the City to promote a new bridge—cycling and walking accounted for about 6 percent of mode share during periods of the year when those modes are at their peak. In the winter that share drops. Yet the new bridge will provide them with over 53 percent of the available deck space. So far there is no evidence to suggest mode share for cycling and walking will ever reach 53 percent, but they got it anyway.

The City of Victoria Engineering Department's traffic counts on the Johnson Street Bridge used in a 2010 economic impact analysis to support a new bridge: Autos on left, buses centre, bicycles on right.
Reading the various responses to our story, I got the strong impression that cyclists were not willing to consider the story’s core idea: Transportation infrastructure decisions need to more strongly reflect the urgent need to reduce transportation emissions, and we need better, more timely information on vehicle use in the CRD in order to gauge the effectiveness of the strategies that are being employed to reduce emissions. By “better” I mean more trustworthy information, the gathering of which is insulated from the influence of special interest groups like the Greater Victoria Cycling Coalition, engineering and project management corporations, or current and former politicians.
In email exchanges with Litman and others, it emerged that, in their minds, Focus had written the wrong story. The cycling advocates were furious that our article focussed so narrowly on the issue of emissions reduction rather than fully explaining all the other benefits that more cycling infrastructure would bring, such as cleaner air, greater personal safety for cyclists and a reduction in vehicle congestion.
Litman wrote, “Public investments should be evaluated based on total benefits and costs. My report, ‘Evaluating Active Transportation Benefits and Costs’ (vtpi.org/nmt-tdm.pdf ) provides a framework for doing just that: it identifies about a dozen categories of impacts (benefits and costs) that should be considered when evaluating walking and cycling policies and programs, including direct impacts on users, and indirect impacts on society. Your column only considered two benefits: increased user safety and climate change emission reductions. That is grossly incomplete and undervalues cycling improvements.”
Our story, in fact, made no attempt to examine “increased user safety” beyond presenting Mayor Helps’ publicly stated position. Nor was it our purpose to present any of cycling’s other benefits. Our focus was on emissions reduction and getting better information.
Litman encourages us to evaluate cycling infrastructure on the basis of total benefits and cost, but this would be an exceedingly speculative endeavour. Consider cost. The 2011 CRD Pedestrian and Cycling Master Plan—the only plan for building cycling infrastructure in the member municipalities of the CRD—estimated the cost of a region-wide bicycle network at $275 million. But that plan didn’t include any cycling improvements on Pandora Street. Yet it’s still the “Master Plan.”
Indeed, the plan estimated costs of $3.3 million for 22.7 kilometres of “priority” bike lanes in the City of Victoria. But that’s a lower cost than the actual cost incurred for only 1.4 kilometres of protected bike lanes on Pandora (which wasn’t in the plan). And, optimistically, the plan estimates the cost of “all projects” (54.7 kilometres) in the City of Victoria at $12.4 million. Yet that won’t even cover the four legs of the 5.3-kilometre-long protected network in the Downtown core.
The plan’s estimates for other municipalities seem even wilder, if that’s possible. For example, it put the cost of 26.5 kilometres of bikeway in View Royal at $36 million. Why would $36 million be spent way out in View Royal and only $12.4 million in Victoria? By the way, the consultant who wrote the CRD’s Master Plan lived in Oregon.
Even if we did have a good grasp of the benefits an advanced cycling network might provide, the cost estimating that has been done so far is deeply flawed. So how can a useful cost-benefit analysis be conducted? Again, the CRD needs more trustworthy information gathered by a process that’s insulated from special interest groups.
In any case, cyclist-centric claims about mode share, costs and fairness—and the backlash from other parts of the community those claims generate—are diversions for which we no longer have time. Shouldn’t the choice about how to transform our transportation system be simpler than that? Shouldn’t it be: Are we going to make a serious attempt to meet the federal emissions target or not? If we are, what do we need to do to accomplish that? Personally, I’m not interested in writing about all the benefits of a “sustainable” transportation system if that system won’t come anywhere close to meeting our 2030 emissions reduction target.
So here’s the crux of the problem: The emissions reduction potential of an improved cycling network, if that’s all that’s executed, is limited. A paper published by Litman quoted results from “a detailed study of five US communities with active transport improvements” which found the improvements resulted in a reduction of “one to four percent of total automobile travel.” A “one to four percent” reduction would be the equivalent of rearranging the deck chairs as the ship is sinking. We need a 34 percent reduction in 12 years.
Let’s shift back to what our regional transportation system would need to look like by 2030 so that we could meet that target. To get a clearer picture, let’s start in the Netherlands.

The Netherlands has invested billions of dollars in public transit and infrastructure for bicycles and pedestrians. Is this a solution for Victoria?
STATISTICS NETHERLANDS REPORTS that, in 2015, with 1.1 bicycle for each of its nearly 17 million inhabitants, that country had “the highest bicycle density in the world.” Featured prominently in its depiction of that country’s transportation system is a chart showing the percentage that each different mode contributed to transportation of people on land—bicycles, cars, buses, trains, walking, etcetera. Percentage of what? The percentage of the total distance travelled:

Domestic distance travelled by transport mode in the Netherlands (Source: Statistics Netherlands)
According to Statistics Netherlands, cars accounted for 73 percent of the total distance people travelled within their country. Public transit provides 12 percent, bicycles 7 percent and walking 3 percent.
The City of Amsterdam, considered to have the greatest regional participation in cycling of any large European city, also publishes comparisons of the extent to which each transportation mode is used within that city, both by mode share and total distance travelled:

Mode share (left) and share of total distance travelled (right) in the City of Amsterdam (Source: City of Amsterdam)
The combined mode share for cycling and walking amounts to 54 percent (30 + 24). Yet when the total-distance-travelled lens is applied, together they account for 14 percent (12 + 2). The Dutch, rightfully proud of their extensive use of bicycles for transportation, have no problem being transparent about how much of the work of transporting people is done by each mode. Cars, at 54 percent, still account for the majority of the work done. (According to TomTom, an Amsterdam-based company that measures vehicle congestion all over the globe, Amsterdam’s traffic congestion is increasing; it’s already at a level higher than many American cities.)
In the CRD, 88 percent of that work is being done by cars. The 34 percentage points of difference between Victoria’s and Amsterdam’s reliance on fossil-fuelled cars to transport people is, completely coincidentally, equal to the shift Victoria would need to make by 2030 to be on a path that would meet the federal mid-century goal.
In other words, Victoria would need to become Little Amsterdam (Amsterdam has a metropolitan population of 1.6 million, Victoria’s is 368,000) within 12 years—the equivalent of a moonshot.
Amsterdam’s achievements, it should be noted, include extensive bus, tram, metro and railway networks which provide the means to extend the length of a trip that a person starts and ends as a pedestrian or a cyclist. This achievement has taken many decades and many billions of dollars. For example, the city’s 73 kilometres of underground metro lines have a current value of $30-40 billion.

Amsterdam’s highly developed public tramway, metro and railway system. Bus routes aren’t shown. Estimated cost? Unknown, but the 9.5-kilometre North-South Line (shown by the blue line), a new metro line currently under construction, will cost the equivalent of $4.6 billion CAD.
What would Victoria need to do to knock 34 percent off its emissions tally? Let me take you through that exercise, but keep in mind that this is an arithmetical exercise performed only to provide you with a sense of the magnitude of the challenge we face. To do it we need to start with some basic assumptions.
First, let’s assume 4 percent of fossil-fuelled auto travel in the CRD shifts to electric cars over the next 12 years (it’s currently less than 1 percent). That would take care of 4 percent of transportation emissions and our reduction requirement would fall to about 30 percent. If there’s a quick breakthrough in super-capacitor technology, which could replace the lithium ion batteries currently used in electric vehicles, this shift could eventually be much higher. But even such an unexpected breakthrough wouldn’t have a big impact over the next 12 years.
Secondly, let’s assume there will be only minor emission reductions as a result of people using cars with higher fuel efficiency. In the USA earlier this year, Trump ordered a review of Obama’s regulations requiring much greater fuel efficiency by 2025. There’s broad expectation in the US that those standards will be rolled back, partly because car manufacturers have made the case that Obama’s regulations can’t be met without making cars unaffordable. Canada harmonizes with the US on such matters, so higher fuel efficiency seems like a long shot. Still, let’s include a conservative five percent reduction in car emissions due to fuel efficiency gains by 2030. Now we’re down to the need for a 25 percent reduction from taking other actions.
Most people are aware of the need to reduce emissions and believe they already limit their travel to only what’s essential. That leaves government only one option: somehow persuading drivers to replace 25 percent of their current auto travel with a combination of public transit, bicycling or walking. How will we be persuaded? There would be no need for a carbon tax if people would voluntarily limit their auto use to the level governments told them was necessary. But we’re not like that, so implementation of a much higher carbon tax to start pushing the most cost-sensitive drivers out of their cars would have to occur soon. The Province’s account of BC’s emissions shows the current level of the carbon tax doesn’t appear to be having much bite, especially with gas prices as low as they are. So our last assumption is that much more serious fuel-cost persuasion will begin soon.
With current total travel by autos in the CRD running at approximately five million kilometres each day, 25 percent of that—or 1.25 million kilometres per day—would need to be shifted from cars to buses, walking and cycling. However, in reducing the distance driven by autos by 25 percent, we would also likely displace 25 percent of the 1 million kilometres travelled in autos by passengers each day. So the shift to public transit, walking or bicycles would need to amount to about 1.5 million kilometres per day.
Doubling the mode share of buses by 2030—the CRD’s stated goal—would cover about 500,000 kilometres of the required shift. The remaining 1 million kilometres of the shift would fall to walking and cycling. When added to their current levels, that would mean that cycling and walking would account for about 1.2 million kilometres each day, or about 18 percent of the total distance travelled—in just 12 years time.
Now compare that with Amsterdam. Its combined total for bicycles and walking is 14 percent of the total distance travelled—a level that has taken several decades and billions of dollars invested in infrastructure for walking, bicycles, buses, subways, trams and commuter rail. Moreover, Amsterdam has packed 1.6 million people into an area about the same size as Victoria’s metropolitan area. That high population density, over four times Victoria’s, is essential for the financial viability of Amsterdam’s expansive, complex and costly public transit system.
For the CRD’s vaguely-outlined plan to work, the distance travelled by cycling and walking would have to increase by about 600 percent (over levels in 2011) within 12 years. For a City with a steadily aging population and a so-so transit system, is this realistic? Has the CRD come up with the moonshot plan that will reduce the region’s transportation emissions by 34 percent within 12 years?
So far, only minimal information has emerged into public view about how the region’s public transit system will evolve so its mode share doubles by 2030. What seems evident is that the rationale stated in the CRD’s Regional Transportation Plan for very expensive rapid transit is much more of a response to brief periods of traffic congestion—along the Trans Canada Highway out to Langford, and the Pat Bay Highway out to Sidney, during peak commuting periods—than it is a response to the need to cost-effectively reduce emissions throughout the day.
The assumption that such congestion will continue on the Trans Canada, even after the new McKenzie Road interchange is complete, is founded on the debunked theory that most future growth in the region will occur in Langford. The 2016 census data shows that over the past 15 years—Langford’s glory years—the Core’s share of the metropolitan population has hardly changed, dropping from 68 percent to 65 percent. That strongly suggests the best place to focus future investment in public transit is where most of the people already live—in Victoria and Saanich. Instead, the CRD could be the first government in history to plan for an LRT to Nowhere.
After the next 12 years, of course, the same rate of shift from autos to public transit, cycling and walking would have to continue—right through to 2050. Keep in mind, too, that transportation emissions in Canada amount to about 24 percent of total emissions, so to be on the most gradually descending path to 2050, all the other sectors would need to be reducing their emissions as well. That will impact all of our lives in ways that, at this point, we haven’t yet imagined. But unless we do it—according to the world’s best scientific minds—we’re cooked.
Is Victoria’s political culture up to the task of getting us through this daunting challenge? The short answer may lie in the record of the attempt to build a new Johnson Street Bridge. An even more chilling possibility is hinted at by the misplaced effort to convert Victoria’s safe, source-controlled, low-cost, tidal-powered marine-based sewage treatment system to a land-based system that will cost Victorians billions of dollars over the life of the infrastructure that’s being built. According to DFO scientists, land-based sewage treatment will have negligible effect on environmental conditions in the Strait of Juan de Fuca. The existing marine-based system was endorsed by an overwhelming number of Victoria’s marine scientists and current and former public health officials.
One of the DFO scientists I spoke with during those deliberations was Sophie Johannessen, the lead author of the peer-reviewed study that found land-based treatment would have a negligible environmental effect on environmental conditions in the Strait.
I asked Johannessen if there was anything the community could do that would have a more positive effect on marine ecosystems than moving Victoria’s marine-based sewage treatment system onto land.
“I think so, yes,” Johannessen said. “We could reduce our greenhouse gas emissions, enact source control for persistent contaminants, and reduce other local pressures on the marine biota.”
The local political culture didn’t listen to the scientists. Instead it followed Mr Floatie to Seattle and started the never-ending process of flushing billions of dollars down our toilets. On atmospheric emissions, the scientists have spoken loudly and clearly: there’s a pressing need to act. In response, will our politicians be led by special interest groups? Or will their decisions be based on science and evidence?
David Broadland is the publisher of Focus Magazine.


Recommended Comments
There are no comments to display.